Search Knowledge Base by Keyword
FlexSDS Dashboard
Launch FlexSDS Scale-out storage WEB management platform, the home page is dashboard, user can also click Home->Dashboard to launch the storage cluster dashboard page.
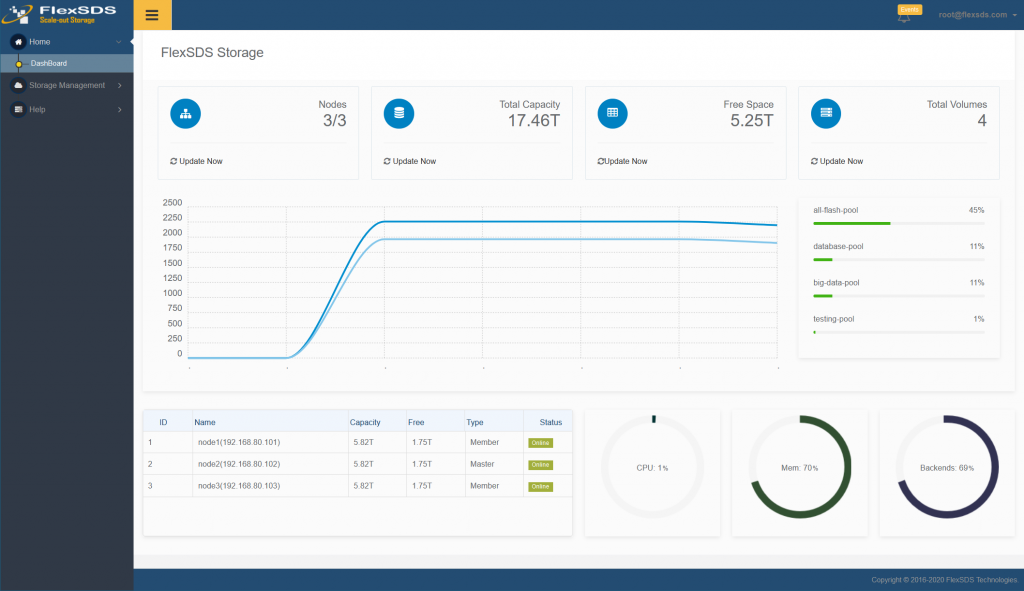
The dashboard shows the current storage cluster’s active status:
- Nodes, shows online nodes and total nodes, if 2 of 3 nodes are alive, it will show Nodes 2/3.
- Total Capacity, in cluster mode, it will show total capacity of all nodes, in standalone mode, will show total capacity of the current node.
- Free Space, in cluster mode, it will show total free space of all nodes, in standalone mode, will show free space of the current node.
- Total Volumes, total volumes created in the cluster.
- IO Performance, in the chart view, deep blue line indicate read speed, and blue line shows write speed, unit is MB/s.
- Storage Pool usage, in the middle right of the dashboard, it shows four highest used storage pools, shows how many percents of space used.
- Top four nodes, show up to 4 nodes, user can select one node, Dashboard will show CPU, Memory and Back-ends usage on the right side.
The Dashboard will automatically refresh in every a few seconds, user can also click Update Now link or refresh the whole page to manually updates.